Android app
for rational
long-term investors
Let statistics be your friend.
Maximize stock returns
Let statistics be your friend.
Maximize stock returns

Each investor strives for the maximum profitability of their stock portfolio. But higher returns are always associated with a higher risk of losses.
Fortunately, this dilemma has purely mathematical solutions. The study of this problem led to the emergence of Modern portfolio theory. This brought several Nobel Prizes in Economics to scientists who worked on related ideas in the following decades.
But you don't need to be a scientist.
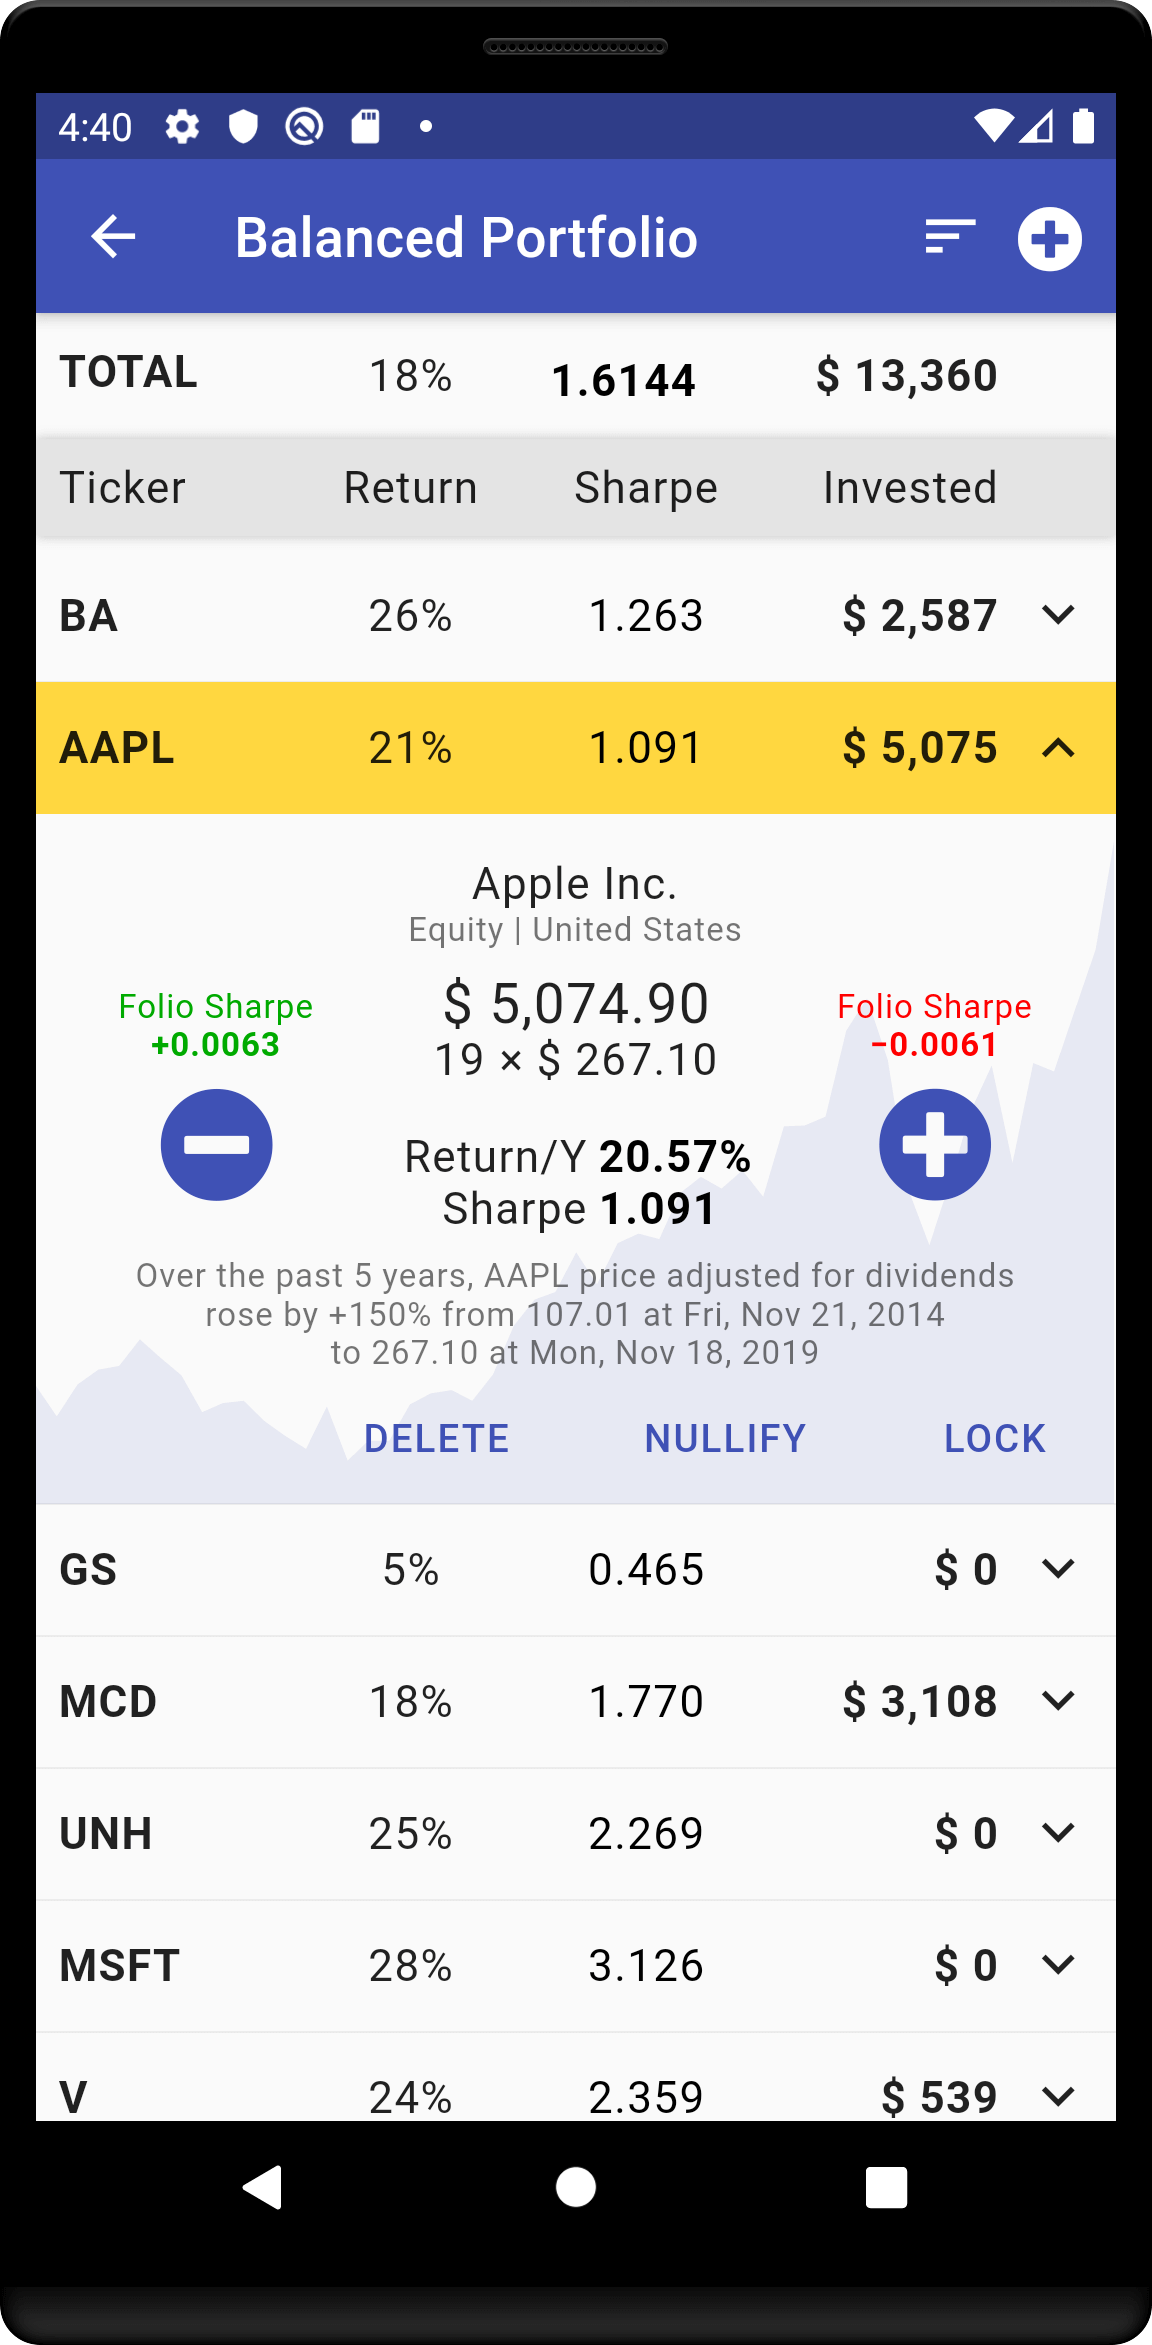
Investment is not just about picking stocks, but about choosing the right combination of stocks.
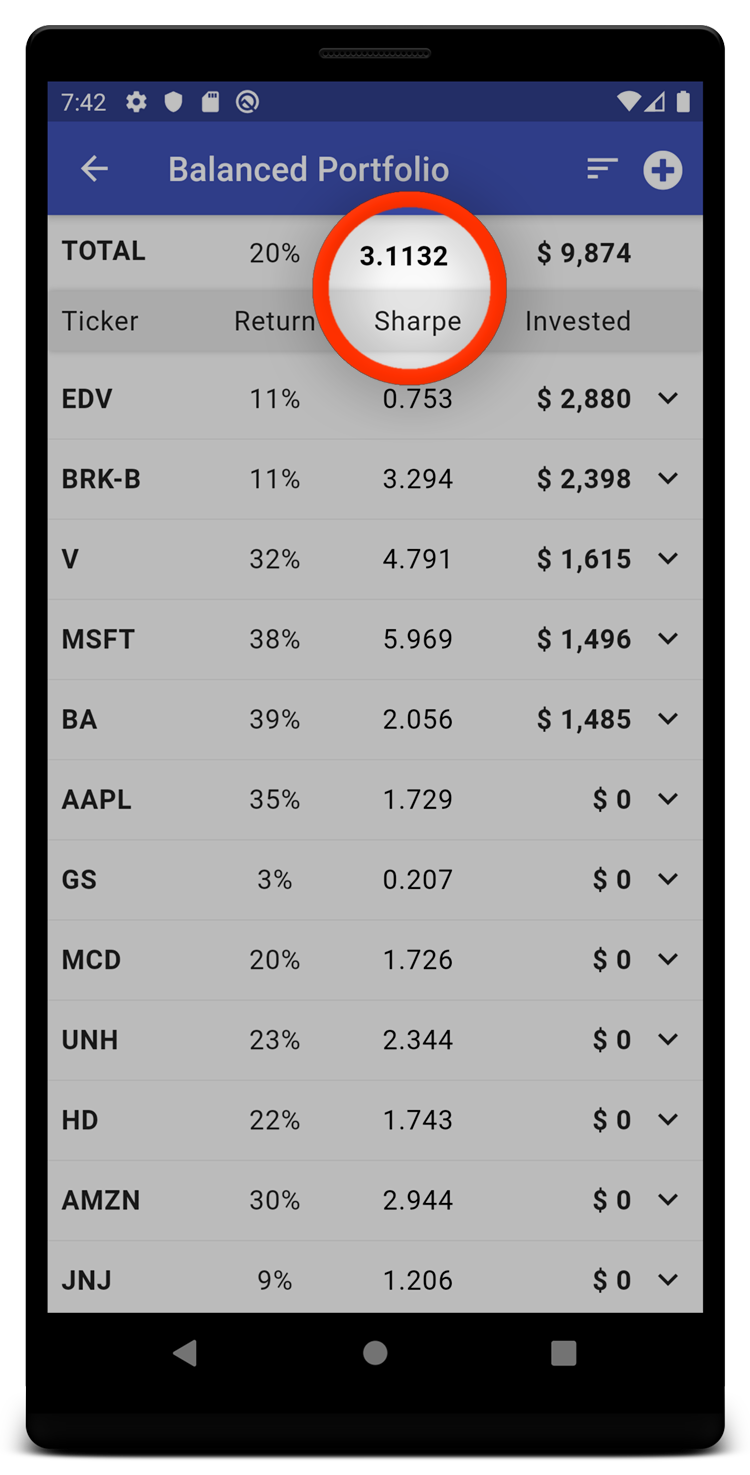
Equition can calculate how good the chosen combination is and will show the result as a single number.
This metric is called risk-adjusted return. The higher the risk-adjusted return, the more generously the investor's risk is rewarded by the market.
All portfolio modifications instantly affect the metrics displayed by the app. By changing amounts of securities so that the metric increases, you make the portfolio more safe, more profitable, or both.
The metrics calculated by the app show how the securities and portfolio performed in past years or even decades. But you will have to decide for yourself whether the established trends will continue.
Equition can be a complement to your own market analysis, helping you make informed decisions, knowing whether your future portfolio shows historically high and stable returns.
It is not just average returns of securities. It is the quality of the portfolio as a whole indicating how well the securities are diversified (excluding harmful correlation between them) and what are the chances of achieving the desired level of profitability.
Securities traded in the United States for US dollars
Historical prices up to 20 years in the past. Updated weekly on Fridays, after the close of the trading week.
Cash dividends are included in the calculations as if they were immediately reinvested back into the same shares.
Annualized Rate of Return with compound interest taken into account
Most metrics optionally support setting the "minimum acceptable return" parameter. In the case of the Sharpe ratio, the minimum acceptable return is used as a "risk-free rate".
Calculations are performed independently for individual securities and for the portfolio as a whole.
All calculations are based on logarithmic returns.
Equition is available for
Download now to get started.